






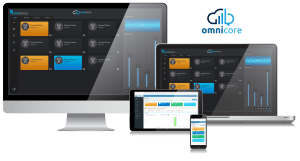
MIssion-Critical Uptime
Dispatch system monitoring that
flags faults before operators do.
One dashboard monitors the omnicore server, SQL database, radio gateways and every operator console — across omnicore Express, Essentials and Enterprise Dispatch deployments.

omniSentinel
A single, live view of your entire dispatch deployment – before a problem reaches the control room.
Every omnicore deployment depends on multiple components working in unison: the omnicore server, the SQL database, the radio gateways and every operator console. When any one of them degrades, the effects are felt immediately in mission-critical communications.
omniSentinel brings all of those components under one continuously updated dashboard – on your own network, with no cloud dependency.
Server
A Windows service that hosts the dashboard, receives reports from agents, polls the database and polls each radio gateway. One per site.
Agent
A small background service on each dispatch console (and optionally on the omnicore server) that reports local health metrics every 30 seconds.
Analyser
An offline desktop tool for air-gapped sites. Opens an exported telemetry bundle and replays the same dashboards and reports without any network connection.
omniSentinel
Launching October 2026
Gain greater visibility into your omnicore ecosystem with proactive monitoring, system health insights, and recommendations designed to help maximize uptime and performance.

One unified dashboard for the entire omnicore deployment.
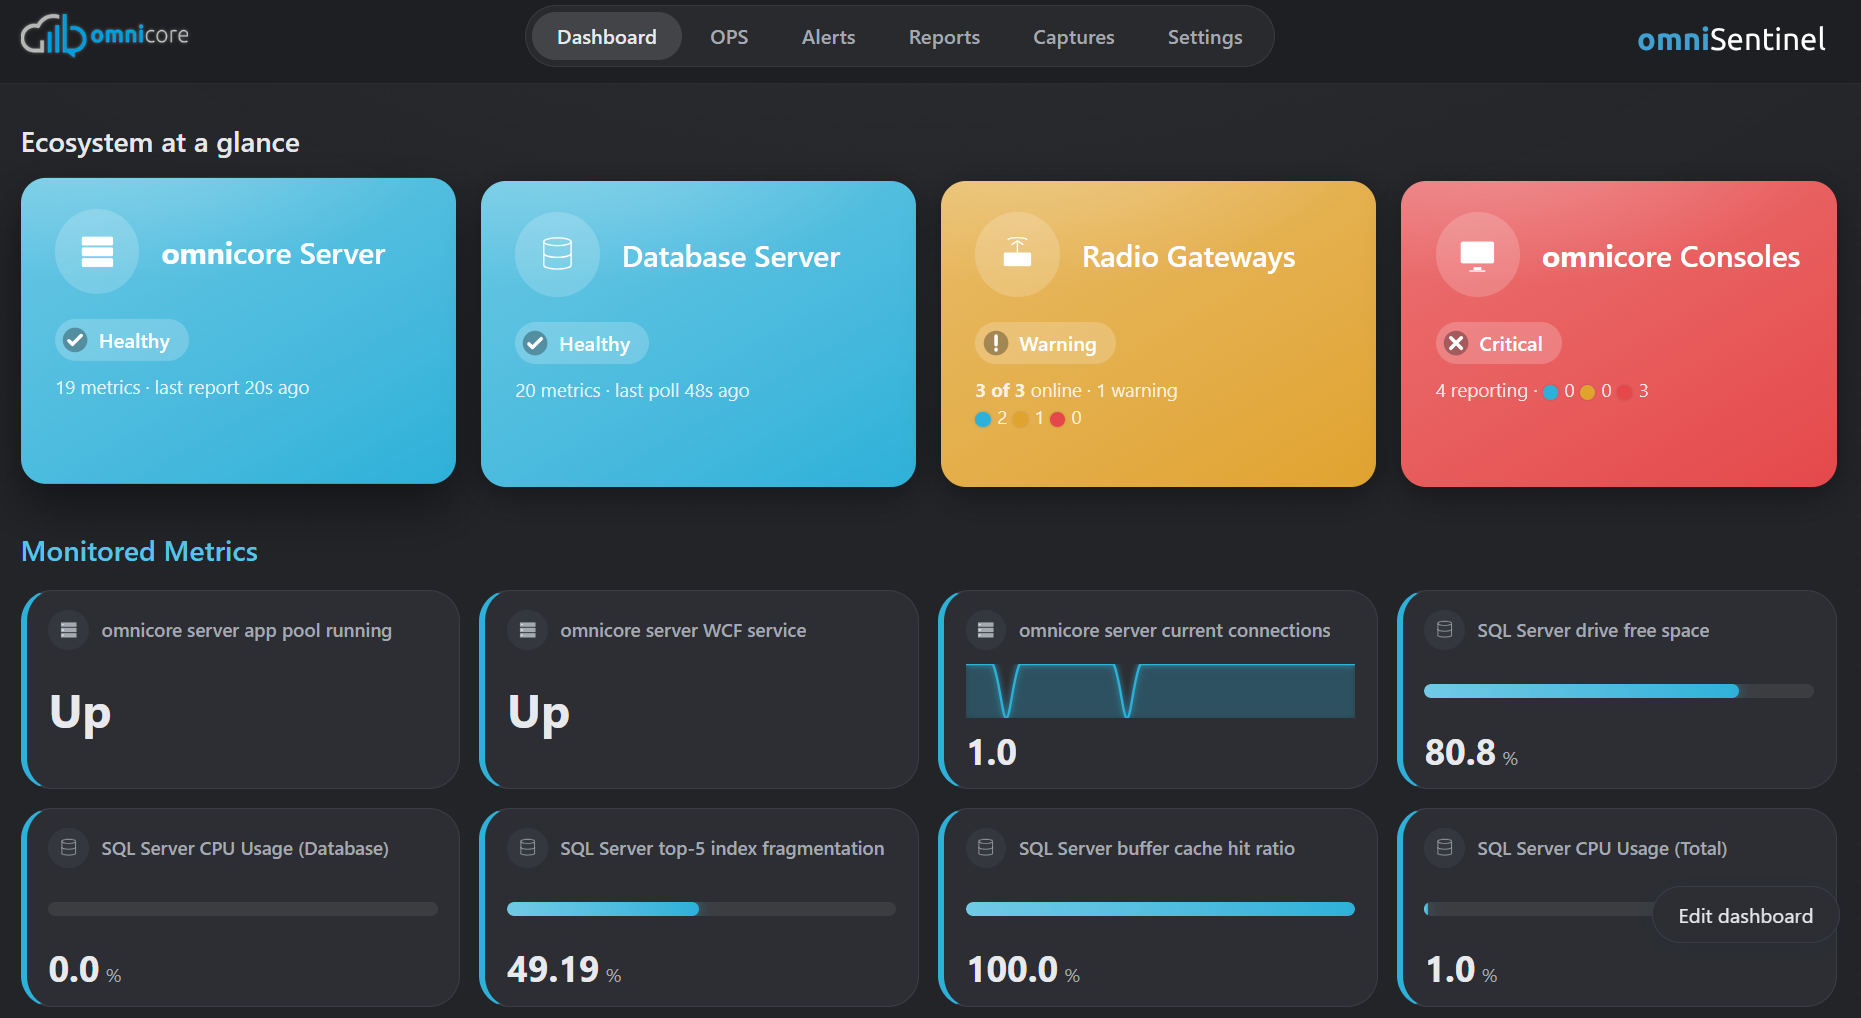
omniSentinel is an on-premises monitoring platform designed specifically for omnicore dispatch installations. A persistent status strip across the top of the dashboard displays the health of the four core ecosystem components – server, database, gateways and consoles – updated every 30 seconds from live agent data. This is not a snapshot; it reflects the current state of the deployment at all times.
Below the status strip, operators and administrators can configure a fully customizable monitoring workspace. Up to 16 metric tiles, trend charts and wall-boards can be arranged to display the data most relevant to each role. Health status is color-coded across three levels – blue for healthy, amber for warning and red for critical – with every threshold set to match the specific baseline of each environment.
Monitoring
Every layer of the dispatch estate, watched continuously.
From console audio latency to database buffer-cache and gateway SNMP alarms – omniSentinel surfaces the signals that matter.
omnicore Consoles
A lightweight Agent service runs on each dispatch console and reports every 30 seconds. It monitors CPU and RAM usage, omnicore.exe process health, kernel-level audio latency (ISR/DPC), RTP jitter, packet loss and audio MOS score - the signals behind choppy audio and dropped channels.
omnicore Server
The Agent runs in server mode on the omnicore application box and monitors three independent health groups: the IIS application pool, the WCF console-to-server service (unencrypted port 60828 and TLS port 8443) and the web configuration portal. A stalled WCF service shows critical even while the app pool and portal remain healthy.
SQL Server
The omniSentinel polls the omnicore SQL database directly - no agent required on the database host. It tracks CPU, memory, buffer-cache hit ratio, page life expectancy, TempDB usage, disk latency, backup status and index fragmentation. Every metric carries a configurable warning and breach threshold.
Radio Gateways
Every radio gateway is probed over SNMP, TCP and ICMP. Supported families include IPR110+, IPR400, DRG100, omniGate (P25 and DMR) and Tetra. TCP latency, packet loss, VOIP link status and radio alarms are surfaced per gateway - including silent failures that dispatchers would only notice as dead air.
Ecosystem Health Server
A Windows service installed once per site. It receives Agent reports, polls SQL Server and probes radio gateways. All data stays on the customer LAN - no cloud dependency, no inbound internet connection required. Agents can be silently updated via an admin push from the Consoles page.
In any browser
Dashboard - four live ecosystem status tiles (Server, Database, Gateways, Consoles) refreshing every 15 seconds.
OPS wall-boards - full-screen dark kiosk display boards for NOC and control rooms.
Alerts - rule-based notifications via email or script with configurable debounce and quiet-hours schedules.
Reports - PDF or DOCX reports with narrative findings, generated on demand.
Features
Built for the control room. Trusted by support teams.
Every feature in omniSentinel is designed to give the people responsible for dispatch uptime a clear, complete picture of the system at all times.
Live Dashboard
A persistent header row displays four headline status tiles – omnicore Server, SQL Database, Radio Gateways and Dispatch Consoles – continuously updated from live data. Below this, a fully configurable workspace supports up to 16 drag-and-drop metric tiles, trend charts and status overviews. Clicking any headline tile drills directly into the metrics driving that status. The dashboard layout is saved per deployment.
NOC Wall-Boards
(OPS Dashboard)
The OPS module enables purpose-built monitoring walls for network operations centers and control room environments. Multiple independent boards can be configured per site, each with its own URL and metric selection. Tile types include large-format numeric displays, sparklines, status pill grids and trend charts, all resizable and freely arrangeable. Boards are optimized for full-screen kiosk display.
Alerts
Alert rules are configured per metric with separate warning and critical thresholds, debounce periods and delivery targets. Notifications are sent by email or via script, enabling integration with SMS gateways or other downstream systems. Multiple alert targets are supported per rule. Schedules control when alerts are active – options include always on, business hours only, after hours only, weekdays only and weekends only – allowing maintenance windows and planned downtime to be excluded from alerting automatically.
Reports
Scheduled and on-demand reports are generated as PDF or Word documents with plain-language findings and a recommendations section, not raw metric exports. Available report types include executive summary, service reliability, radio gateway health detail and console health detail. A custom report builder allows any combination of these sections to be assembled into a single document, with filtering by specific console, gateway and time range (24 hours, 7 days, 30 days, 90 days or a custom date range). Individual recommendations within reports can be selectively enabled or disabled.
Captures
Windows event logs at warning level or above are automatically collected from each monitored console and centralized on the omniSentinel Server, enabling review without physical access to the machine or remote connection to a secure environment. If the omnicore console application crashes, the crash dump is captured and uploaded automatically. Automated packet capture is planned for a future release.
Offline Analyser
For air-gapped and high-security sites without internet access, a complete telemetry export can be generated as a portable .zip file and shared with Omnitronics support. The Analyser tool opens this bundle and presents the same dashboard views as the live system, together with metric-correlation tools for identifying causal relationships between events. Investigation is conducted entirely offline, without any connection to the live deployment.
Fleet Monitoring
For resellers and network operations centers managing multiple deployments, the Fleet module aggregates the status of all monitored sites into a single view. Cross-site alerts are generated when any deployment turns critical or goes offline. Each alert includes a scoped snapshot of the affected site, enabling immediate drill-down into the specific metrics that triggered the status change. Fleet monitoring is an optional, per-site configurable feature.
Deployment and Security
On-premises. Installs in minutes. Configurable security.
omniSentinel runs as Windows services on the customer's own hardware. No data is transmitted to external systems unless explicitly configured – for example, to enable Fleet monitoring for a network operations center or to export a telemetry bundle for support analysis.
Installation is completed using separate setup wizards for the server, agent, Analyser and Fleet components.
Server Requirements
- Windows Server 2019/2022 or Windows 10/11 Pro/Enterprise
- 2 cores minimum (4 recommended)
- 4 GB RAM minimum (8 GB recommended)
Agent Requirements
- Windows 11 on each dispatch console
- 100 MB disk space
- Outbound HTTPs to the omniSentinel Server
- Agents silently self-update via admin-triggered push from the Consoles page
On-Premises by Design
- Runs on the customer LAN
- No inbound internet connection required
- No cloud dependency of any kind
- Data stored locally with configurable retention
- Nothing leaves the site unless an administrator exports a bundle
Compatible with all omnicore editions: omnicore Express Radio Dispatch Console, omnicore Essentials Radio Dispatch Software and omnicore Enterprise Dispatch Management System. CapEx and OpEx procurement options available.
Included with omnicare Premium Performance & Protection Plan.
omniSentinel is available at no additional cost to customers with an active omnicare Premium Performance & Protection Plan. Customers with an existing omnicore support contract receive access to the platform and all future incremental improvements as part of that agreement.
Contact an Omnitronics specialist to confirm eligibility or to discuss support plan options.
We'll find the perfect system for your individual needs.
FAQ
Common Questions
Does omniSentinel Ecosystem Health require a cloud connection?
No. The platform runs entirely as Windows services on the customer's own hardware. No data is transmitted externally unless an administrator explicitly exports a telemetry bundle or enables Fleet monitoring for a network operations center.
Which omnicore editions does it support?
omnicore Ecosystem Health works with omnicore Express Radio Dispatch Console, omnicore Essentials Radio Dispatch Software and omnicore Enterprise Dispatch Management System. The monitoring server, agent, and offline Analyser are consistent across all editions.
Which radio gateways are supported?
Supported gateway families include IPR110+, IPR400, DRG100, omniGate (P25 and DMR) and Tetra GatewayDM, all monitored over SNMP. The supported device list is continuously extended. Contact an Omnitronics representative for the current compatibility list.
Will the omniSentinel Server affect dispatch operations if it goes offline?
The Ecosystem Health Server operates independently of the omnicore dispatch system. If it becomes unavailable, dispatch operations are unaffected. omnicore Express Radio Dispatch Console and omnicore Essentials Radio Dispatch Software additionally support a 48-hour Fallback Operation mode, maintaining critical voice communications even if connectivity to the omnicore application server itself is lost.
Can monitoring thresholds and alert rules be customized?
Yes. Every metric can be individually enabled or disabled. Warning and critical thresholds are configurable per metric and tuned to each environment's operational baseline. Alert rules are defined separately, allowing notifications to be scoped to the conditions that are genuinely operationally significant. Alert schedules can exclude planned maintenance periods, out-of-hours windows or specific days of the week.
How flexible are the reporting options?
Five report templates are available: executive summary, service reliability, radio gateway health, console health and a custom builder. The custom builder allows any combination of sections, time range and scope – specific consoles, specific gateways or the full deployment – to be assembled into a single document. Individual recommendations within reports can be toggled on or off. Additional templates and extended customization options are planned for future releases.
What is the Offline Analyser used for?
The Offline Analyser is a companion desktop tool for air-gapped or high-security sites where data cannot be transmitted externally. A telemetry bundle exported from the Ecosystem Health Server as a .zip file can be opened in the Analyser by Omnitronics support to view the full dashboard history and run metric-correlation analysis – with no connection to the live deployment.
How are agent updates managed across multiple consoles?
The Ecosystem Health Server hosts the current agent installer. From the Consoles page, an administrator can push the updated agent to all registered consoles in a single action. Each console downloads and installs the update automatically, then reconnects. The agent version installed on each console is visible in the Consoles view, making it straightforward to identify any machines running an outdated version.
Who is eligible and how is access obtained?
omnicore Ecosystem Health is included at no additional cost for customers with an active omnicare Premium Performance & Protection Plan. Eligibility can be confirmed with an Omnitronics representative, who can also advise on support plan options for customers not currently covered.

MEDIA RELEASE | Omnitronics Releases 100% Software RoIP Gateways
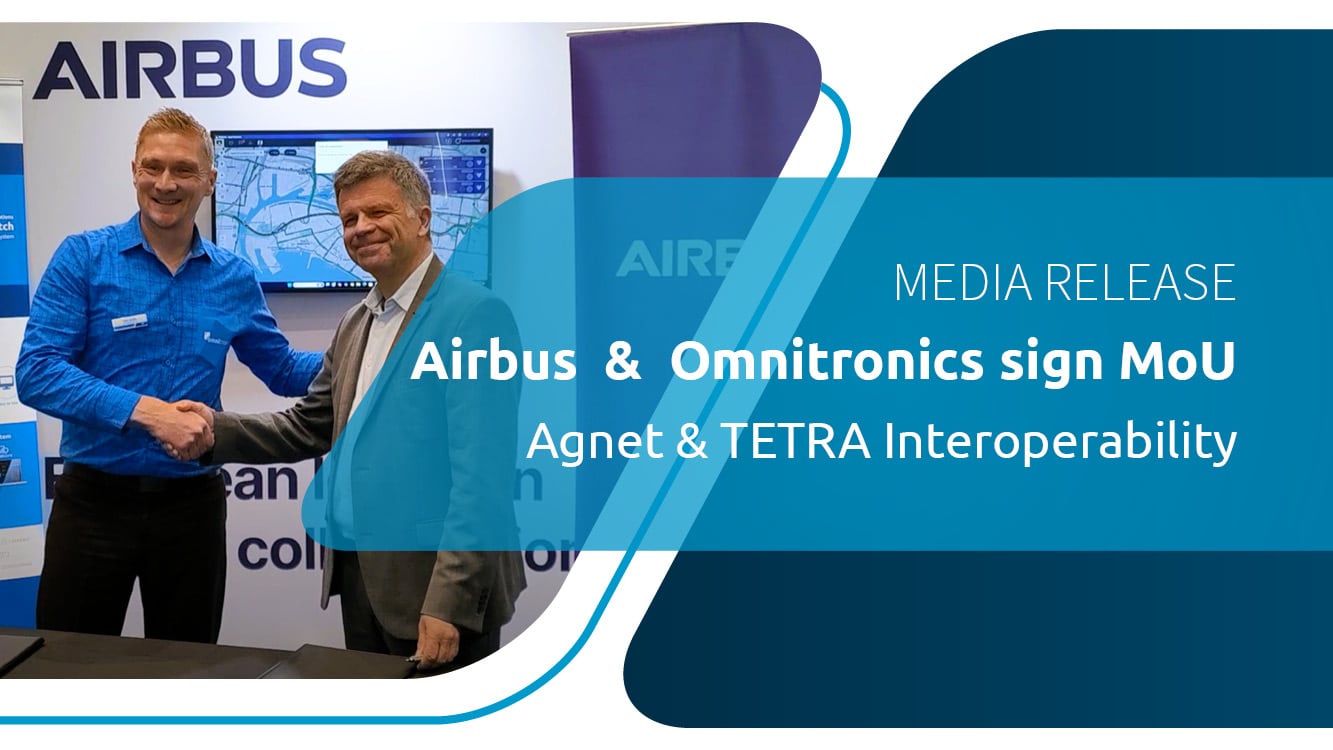
MEDIA RELEASE | Airbus Defence and Space and Omnitronics sign MoU to explore collaboration
Airbus Defence and Space and Omnitronics Sign MoU to Advance Interoperability in Critical Communications Airbus Defence and Space and...

SOLUTION | Connecting Analog Equipment to P25 Talkpaths

Use Case IPR400 S2: Connecting Repeater Sites
Use Case Connecting Two-Way Radio Repeater Sites Using IP When dealing with multiple sites using analog two-way radio that are far apart,...
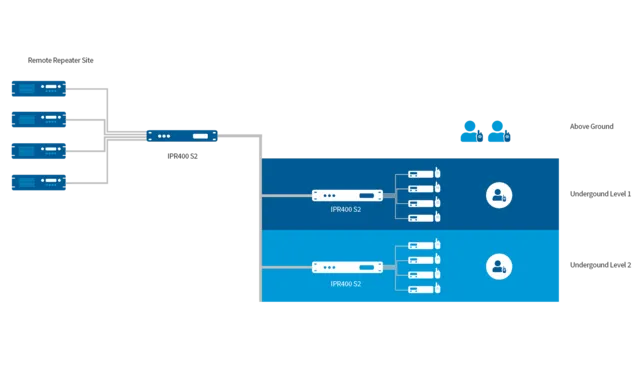
Use Case IPR400 S2: High Path Loss Environments
Use Case High Path Loss Environments In two-way radio communications environments where UHF and VHF signals cannot pass through walls or...
4 Examples of Audio Bridging’s Ease of Use and Reliability
AUDIO BRIDGING EXAMPLES Audio Bridging Examples: Four Organizations, Zero Failures. DFES, Broadspectrum, the Public Transport Authority...